Download Excel 2021 Tips Weekly for learning professional
Link Download Excel 2021 Tips video tutorials
Excel 2021 Tips Weekly for learning professional
Learning with Excel 2021 Tips Weekly
Duration: 38:49:03
Handout type: Video tutorial
English language
Description: This tips-based course will show Excel users productivity-boosting tricks, cool hidden features, need-to-know functions, and advanced content on subjects such as using PivotTables for data analysis. Tune in every Tuesday for a new tip from expert Dennis Taylor. Each tutorial is a short, self-contained lesson guaranteed to give you new insights into Excel
This course brings together tips to help Excel users increase their productivity, discover interesting hidden features. Tune in every Tuesday for a new lesson from expert Dennis Taylor. Each series is a short self-paced lesson that guarantees you new knowledge in Excel
CONTENTS
Excel Tips Weekly
001 – Hide and unhide worksheets securely
002 – Resizing, moving, copying, and manipulating charts and other objects
003 – Using list boxes and combo boxes to facilitate forms creation
004 – Using the FORMULATEXT and N functions for worksheet and formula documentation
005 – Using the ISBLANK and COUNTBLANK functions to check for and tabulate blank cells
006 – Summarizing data from diverse ranges with Data > Consolidate
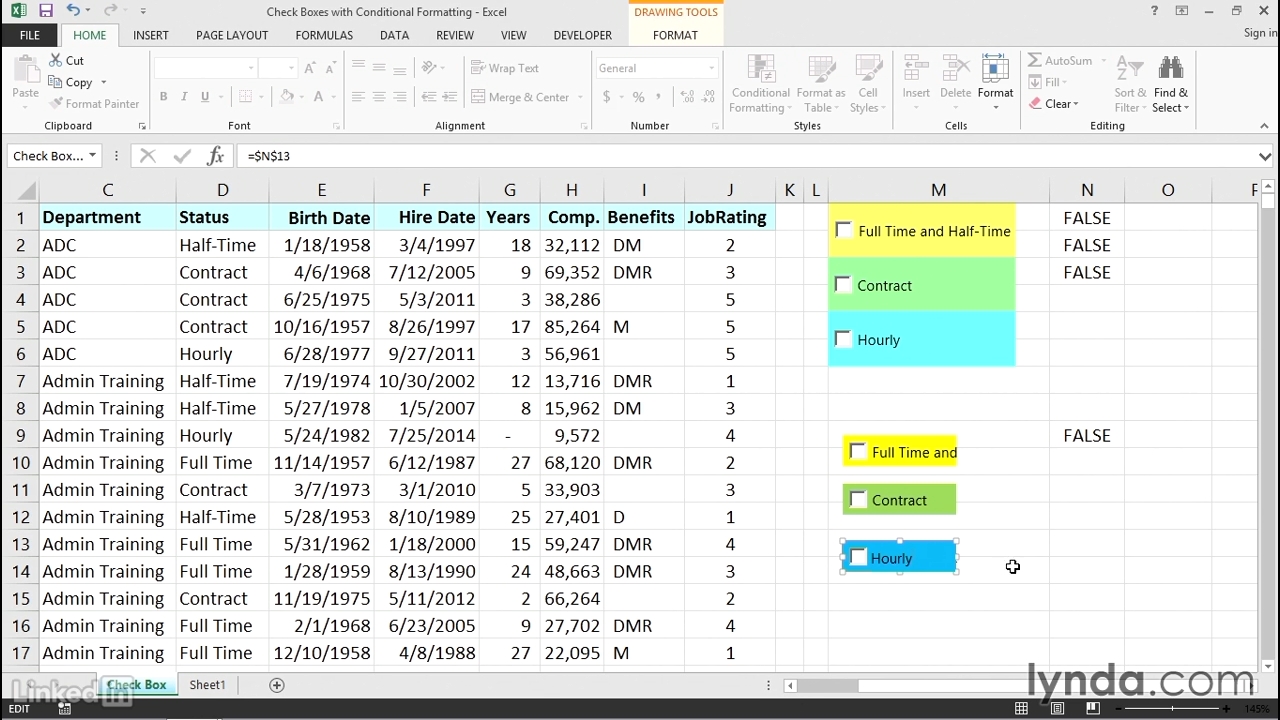
007 – Using check boxes and conditional formatting together for dynamic displays
008 – Becoming more productive with these 10 tiny tips you’ll use often
009 – Transposing data and charts for a different perspective on your data
010 – Applying conditional formatting across rows of data
011 – Exploring various layouts for your PivotTable
012 – Splitting and consolidating workbooks
013 – Using date and time as metrics in a PivotTable
014 – Adding illustrations to your workbook
015 – Using a pick list, VLOOKUP, table, and chart together
016 – Using formulas to calculate values across worksheets and workbooks
017 – Dynamically presenting data via chart slicers
018 – Parsing your data to create unique lists
019 – Using the REPT function to represent data visually
020 – Using source data from a table to make your PivotTable more dynamic
021 – Accelerating Cut, Copy, Paste, and Insert tasks
022 – Increasing your productivity with custom lists
023 – Highlighting PivotTable results with conditional formatting
024 – Customizing templates to fit your unique needs
025 – Creating dynamic charts with in-cell conditional formatting
026 – Enhancing table filtering with slicers
027 – Converting charts into pictures
028 – Custom grouping in PivotTables
029 – Quick formatting tips
030 – The top five unknown but useful keyboard shortcuts
031 – Using the TREND and GROWTH functions for projecting future results
032 – Using scroll bars and spin buttons to facilitate forms creation
033 – Creating colorful 3D buttons for worksheet annotation and macro buttons
034 – Calculating with hours, minutes, and times of day
035 – Tracking down cell dependencies across multiple worksheets and workbooks
036 – Discovering time-saving tools in the Go To Special feature
037 – Adding, managing, and printing comments for worksheet documentation
038 – Reducing data entry time by expanding AutoCorrect options
039 – Setting up custom views for quick access to different worksheet displays
040 – Using hyperlinks for rapidly switching worksheet locations and jumping to websites
041 – Controlling worksheet security by allowing selected users to edit specific cell ranges
042 – Using option buttons, group boxes, and checkboxes to facilitate forms creation
043 – Exploring what-if scenarios using Goal Seek
044 – Creating text, numerical, date, and time lists in a flash
045 – Creating variable conditional formatting rules
046 – Handling dates with unusual formats
047 – Using wildcards (asterisk, tilde, and question mark)
048 – Custom formats using asterisk, semicolon, and brackets
049 – Meeting unusual filtering needs via Advanced Filter
050 – Create an organization chart
051 – Two-way lookup using the MATCH and INDEX functions
052 – Using Excel error-checking functions
053 – Custom formats, relative addressing, and conditional formatting
054 – Auditing
055 – Adding comments and shapes
056 – Drawing borders and border grids
057 – Building a flexible monthly table using functions
058 – Adding pictures as worksheet backgrounds
059 – ADDRESS, ROW, and COLUMN functions
060 – Join data with new CONCAT and TEXTJOIN functions
061 – Working with formulas in tables
062 – Locating data validation rules and violations
063 – Creating an Excel template
064 – Restoring missing column titles
065 – Creating a pick list dependent on another pick list
066 – Using command shortcuts with the Alt key
067 – Set up a macro for sorting dynamic data
068 – Use random number functions for sorting and creating sample data
069 – Use calcuated fields and calculated items in a PivotTable
070 – Replace characters by position with the REPLACE function
071 – Work with formulas in tables
072 – Keystroke shortcuts from A to Z: Using the Ctrl key
073 – Use special tricks for working with dates in charts
074 – Use a data form for data entry and exploring data
075 – Creating an Excel template to simplify updating a monthly file
076 – Calculate dates efficiently using Excel’s hidden function – DATEDIF
077 – Create dynamic sheet name references with the INDIRECT function
078 – Avoid errors and hidden data with the powerful AGGREGATE function
079 – Hide worksheets, row, columns, cells and other Excel elements
080 – Use slicers and charts together for dynamic presentations
081 – Save a chart as a template: Use the template for current or new charts
082 – MAXIFS and MINIFS added to the COUNTIF/SUMIF family of functions
083 – Adjust a chart’s source data and adjust its series order
084 – Use the OFFSET function for tabulating moving data
085 – Alter numeric data without formulas
086 – Use Flash Fill to rapidly combine or separate columnar data
087 – Adjust banded-row formatting
088 – Change the shape of comment boxes and other objects
089 – How and when to use the 10 rounding functions in Excel
090 – Calculate faster with the AutoSum button and AutoSum keystroke shortcut
091 – How to use mixed cell references
092 – Activate the Speak On Enter and Speak Cells features
093 – Accelerate data entry with five special techniques
094 – Insert a text box or shape and link a cell’s content to it
095 – Use Watch Window and other techniques to track changing cells
096 – How to create time interval entries
097 – How to create frequency tabulations and distributions
098 – Create an expanded list from a summary using PivotTable techniques
099 – Solve matching issues with matching phone numbers and SS numbers
100 – Use CHOOSE to calculate fiscal quarters and as a VLOOKUP alternative
101 – Use outlining tools to quickly expand and collapse data for dynamic presentations
102 – Use the SUBTOTAL (and AGGREGATE) functions to avoid double counting
103 – Create lists of all 2nd Tuesdays, last Tuesdays. and other date series
104 – Create linkage formulas that refer to other worksheets and workbooks
105 – Formula nesting: Using multiple functions in the same formula
106 – Keyboard shortcuts for numeric formats
107 – Use the Subtotal command to analyze data with single- or multiple-level subtotals
108 – Work with MAX, MAXIFS, LARGE, and related functions
109 – Use the dynamic TODAY and NOW functions for real-time up-to-date calculations
110 – Use the FIND, MID, LEFT, and RIGHT functions
111 – Flip the left-to-right order of columns with the INDEX function or sort by columns
112 – Working with hidden data when copying cells and creating charts
113 – Use conditional formatting data bars to accentuate negative data
114 – Creative use of sparklines in merged cells with axes
115 – Copy formats quickly using dragging techniques and the Format Painter
116 – Displaying multiple worksheets and workbooks together
117 – Tips for creating and updating sample data
118 – Use conditional formatting to overcome formatting limitations of the IF function
119 – Use VLOOKUP, MATCH, and INDEX functions with array formulas
120 – Summarize data from different worksheets with a PivotTable
121 – AutoFill shortcuts for date series, one/two week intervals, EOM, and formulas
122 – Create summary statistics using COUNTIFS, SUMIFS, and AVERAGEIFS functions
123 – Use custom formulas in data validation to keep out bad data
124 – Dealing with circular errors
125 – Tips for creating charts quickly
126 – Creating heat maps using conditional formatting
127 – Using the INDEX function to extract data by row and column
128 – Displaying tips when using Excel in presentations
129 – The Wrap Text, Merge and Center, and Indent options
130 – Using fill effects (gradients, patterns, styles) for colorful cell background variations
131 – Working with multiple worksheets simultaneously
132 – Exploring font choices not found on the Home tab
133 – Using WordArt for special titles and headings
134 – Creating a two-way lookup with VLOOKUP, HLOOKUP, INDEX, and MATCH functions
135 – Borders and gridlines: Exploring variations, options, and differences
136 – New Excel 2016 chart types: Tree map and sunburst
137 – Freezing column and row titles
138 – Use data validation to force entries to be uppercase or lowercase
139 – Avoiding common chart distortions
140 – Use the new funnel chart available in Excel 365
141 – Combine data using CONCATENATE, CONCAT, and TEXTJOIN functions and the ampersand (&) character
142 – Recognizing Excel Formula errors: #N/A, #VALUE!, #REF!, #DIV/0!, #NUM, and #NAME!
143 – Creating cross-totals with the SUMIFS function and mixed references
144 – New Excel 2016 chart types: Histogram, Pareto, and box, and whisker
145 – Using the AND and OR functions independently or within IF functions
146 – Vertical and horizontal alignment settings and orientation options
147 – Sorting tips and shortcuts
148 – A look at new chart types in Excel 2016: Waterfall
149 – Work with formulas and formats: Decimals and fractions
150 – Creating mixed reference formulas; converting to a table; applying conditional formatting
151 – Control gridlines in charts and on worksheets
152 – Use the INDIRECT function with intersection formulas and range names to extract data
153 – Using Expand/Collapse on PivotTables and PivotCharts for rapid display changes
154 – Control phone number and postal code formats using built-in options or customized formats
155 – Change the default Excel chart type; create and use chart templates
156 – Create your own customized date and time formats
157 – Create on-screen warnings and reminders with comments or data validation messages
158 – Use REPLACE for formats only, for data only, or for both
159 – Create numeric formats: Display in thousands or millions
160 – Converting dates like 20102006 into usable date entries
161 – Create custom lists for letter series like A to Z
162 – Freeze Panes and Split
163 – NETWORKDAYS.INTL and WORKDAY.INTL
164 – Calculate % of change
165 – Fill in all blank cells within a range with either formatting or data
166 – Use the COUNT and COUNTA functions
167 – Use workbook protection to prevent use of sheet commands
168 – Rank data with the RANK and RANK.AVG functions
169 – Use nonstandard fiscal years and quarters in PivotTables
170 – Identify or extract unique entries in a list
171 – Keyboard, mouse, and command techniques for viewing worksheets
172 – Create artistic charts with random numbers
173 – Extract day, month, and year from date fields
174 – Compare data with EXACT, FIND, and SEARCH functions
175 – How to covert ROMAN numberals
176 – Use range names for more readable formulas
177 – Customize your Quick Access Toolbar
178 – Conditional formatting based on date proximity
179 – How to adjust names
180 – Differences and limitations of converting data to a table
181 – Avoid the #DIV/0 error message
182 – Explore formatting options not available on the Home tab
183 – Control table formatting with custom formats
184 – Use date functions for age and tenure calculations
185 – Avoid unintentional entries when typing code numbers
186 – Sorting by moving columns
187 – Calculating cumulative totals
188 – Using the CONVERT function for different numbering systems
189 – Creating an automatically expanding chart by basing it on a table
190 – Keystroke shortcuts using the Alt key
191 – Using the Solver Add-in
192 – Column widths, row heights, merging cells, and related formatting issues
193 – Adjusting default layouts and date grouping in PivotTables
194 – Auditing cell content with Watch Window and dependent cell formulas
195 – Use the LEN and REPT functions for specialized cell testing and display options
196 – Use the TRIM and CLEAN functions to remove excess spaces and non-printing characters
197 – Create double-spaced and triple-spaced printouts while repeating column headings
198 – Helpful keystroke shortcuts
199 – Identify weekdays and weekend days in data
200 – Use chart and filter for presentations
201 – Create picture links
202 – How to use the error-checking rules in Excel
203 – Protect worksheets and lock cells
204 – Use mixed addresses in Excel formulas
205 – Rapid filtering with Filter by Selection
206 – Display large values
207 – Tracking down conditional formatting and data validation rules
208 – Transposing data and using the TRANSPOSE function
209 – Displaying gridlines, borders, and column/row headings when printing
210 – Exploring some of the 200-plus SmartArt graphic options
211 – Using the CEILING and FLOOR functions for specialized rounding needs
212 – Inserting, reshaping, and formatting shapes: Rectangles, arrows, stars, and banners
213 – Tabulating totals with the VLOOKUP function and array constants
214 – Working with array formulas more easily
215 – Using the new UNIQUE function to count and copy unique list entries
216 – Creating and updating sample data
217 – Format macros to make you a more efficient Excel user
218 – Use the new SORT and SORTBY functions to extract sorted lists
219 – Use themes to adjust worksheet colors, fonts, and effects
220 – Calculate loan payments and investments with PMT and FV functions
221 – Use the XLOOKUP function to replace VLOOKUP
222 – Chart display options with blank cells in source data
223 – Adjust Conditional Formatting rules by altering percentage breakpoints
224 – Discover new formula capabilities with new functions and dynamic arrays
225 – Sort or filter data based on color font or cell color background
226 – Simplify the use of special characters and symbols
227 – Select from over 800 icons to enliven worksheets
228 – Use the new RANDARRAY function that replaces RAND and RANDBETWEEN
229 – How and when to use an area chart
230 – Insert colorful images with the People Graph Add-in
231 – Use formulas to create interactive charts
232 – Track variables using the Scenario Manager
233 – Get totals quickly without creating formulas
234 – Use column or row references to create dynamic formulas
235 – Overcoming obstacles when working with dates in charts
236 – Create map-type charts based on geographical locations
237 – Techniques for creating date series
238 – Extract filtered data with data validation and the FILTER function
239 – Use Find and Replace to change cell contents and formats
240 – Add formula tools and symbols to the Quick Access Toolbar
241 – Change PivotTable settings for titles and summaries
242 – Use the Excel filtering capability for dates
243 – Use worksheet names in formulas
244 – Use data validation rules with special phone and social security formats
245 – Work with time calculations in formulas
246 – Prevent and locate duplicate worksheet entries
247 – Look forward and backward using EDATE and other date functions
248 – Display and highlight worksheet formula cells
249 – Split or join columnar data with Text to Columns or Flash Fill
250 – Highlight milestone data with conditional formatting and cumulative formulas
251 – Use the XMATCH function to replace MATCH
252 – Create a powerful macro
253 – Work with hidden and visible data in filtered and subtotaled lists
254 – Use TODAY, NOW, YEARFRAC, and DATEDIF
255 – Use data validation rules to prevent duplicate entries in a range
256 – Use various techniques to hide cells, rows, columns, and worksheets
257 – Align, arrange, and rotate shapes in worksheets
258 – File documentation with the Workbook Statistics button
259 – Avoid misleading visuals when rescaling
260 – Use the Fill Justify feature to wrap long text
261 – Create range names from Column and Row headings
262 – Use the SUBSTITUTE and REPLACE functions
263 – Accelerate Conditional Formatting with the Quick Access Toolbar
264 – Use wildcard symbols in functions
265 – Use wildcard symbols in filtering and commands
266 – Condense lengthy nested IF functions with the newer IFS function
267 – Add flair to charts with these formatting options: Gap width, shadow, glow, 3D, and more
268 – Control worksheet security by allowing selected users to edit specific cell ranges
269 – Retrieve vital data based on location using the Geography tool
270 – Use the new SEQUENCE function to quickly build numeric and date arrays
271 – Calculating text length and word count with LEN, TRIM, and SUBSTITUTE functions
272 – Create a list box to facilitate selection of data from a list
273 – Use various Excel count functions: COUNT, COUNTA, COUNTBLANK, and more
274 – Enhance readability with banded rows via conditional formatting
275 – Seven different ways to drag data using the Ctrl, Shift, and Alt keys
276 – Use the SWITCH function: Compare with IFS, CHOOSE, and other lookup functions
277 – Adjust charts quickly with quick layout, change colors, and chart styles options
278 – Analyze PivotTable data with 13 different Show Values As options
279 – Expand/collapse or sort displayed results when using the SUBTOTAL command
280 – Use the AGGREGATE function to circumvent errors and ignore hidden data
281 – Use the F9 key to evaluate parts of a formula, recalculate random entries, and control iteration
282 – Using last-to-first (bottom-up) searches with XLOOKUP and XMATCH
283 – Explore Paste Special options – Skip Blanks, Column Widths, Add, Transpose, and more
284 – Reduce data entry drudgery with Ctrl+Enter, AutoComplete, and AutoCorrect
285 – Using the LET function to simplify formulas via programming concepts
286 – Create 51 new US State worksheets, or any multiple cluster of worksheets, in a flash
287 – Create moving averages with formulas and chart trendlines
288 – Use error-checking functions in Excel – IFERROR, ISERR, and ISERROR
289 – Use Alt+Enter and Wrap Text for line-wrapping titles and improving formula readability
290 – Work with cell colors, patterns, and effects to emphasize data and provide visual flair
291 – Dynamic array formulas, new ways to calculate – One formula displays results in multiple cells
292 – Fonts such as Arial and Calibri and a rundown of various available fonts in Excel
293 – Use 3D formulas to tabulate data from multiple worksheets with the same layout
294 – Multiple built-in date formats as well as tons of self-defined variations; m_d_y and mmm-d-yyyy [no subs]
295 – Where does that cell get its data from – Tracking down cell precedents
296 – Controlling date entry restrictions using data validation
297 – Remove duplicates from a list vs. creating a new list without duplicates
298 – New data types Extract valuable online data into your worksheets
299 – Use the FILTER and UNIQUE functions together for dynamic extractions
300 – Adjusting text entries with the UPPER, LOWER, and PROPER functions
301 – Refine filtering needs via custom filter options
302 – Comparing column charts and bar charts: Pros and cons (no subs)
303 – How to use exponentiation (powers and roots) in Excel formulas
304 – Tracking down errors with the ISTEXT, ISNUMBER, and ISNONTEXT functions
305 – Tips for saving time when typing function names
306 – SUMIFS, SUMPRODUCT, and SUM functions compared and contrasted
307 – Conversion of values into binary, octal, decimal, and hexadecimal equivalents
308 – Quick number formatting with keystroke shortcuts and icon buttons
309 – Date calculation and formatting issues related to the 2029/2030 switch
310 – Using wildcards in the new XLOOKUP and XMATCH functions
311 – Using slicers as analytical tools
312 – Conditional formatting using contrasting heat maps on multiple vs.single ranges
313 – Create dynamic pick lists using the UNIQUE and SORT functions, and data validation
314 – Contrasting uses of clustered column and stacked column charts
315 – Use the XLOOKUP function with multiple column criteria and multiple column results
316 – Tips for updating entire columns of date entries when using real or sample data
317 – Using TRIM, CLEAN and other functions to clean up text data
318 – Create multiple range names from the top row and/or left column
319 – Use dragging techniques to extend dates by weekdays only, month, or year
320 – Use the LAMBDA function to create worksheet functions
321 – Get the formula results you want using Goal Seek
322 – Sort your data based on a Custom List that you define
323 – Create a dynamic sheet name reference with the INDIRECT function
324 – Calculate dates and/or days of the week for selected future holidays
325 – Use dragging techniques for faster Paste Special options
326 – How to use and not use SS numbers; fake SS numbers; display as XXX-XX-9999
327 – Five indispensable keystroke shortcuts for Windows and Mac users
328 – Using new formula-writing techniques to simplify wide-ranging formulas
329 – Calculate time differences within days and across multiple days
330 – Use keyboard, mouse, and commands to zoom in/out quickly in Excel Windows and Mac versions
331 – Make dynamic presentations with rapid expand/collapse detail features in outlining
332 – Get data analysis suggestions with the Analyze Data (formerly Ideas) tool
333 – Using the Distinct vs. Unique options when using the UNIQUE function
334 – Use the Screen Snip tool or keystroke shortcut to take a picture of the screen or a portion of it
335 – Exploring Excel’s Sunburst chart to display hierarchical data
336 – Creating floating text boxes with shadow, reflection, glow, and other shape effects
337 – Page Setup tip: Print repeating titles, shrink-to-fit, landscape/portrait, double-spaced layout
338 – Use Data Validation based on multiple criteria
339 – Customize the Quick Access Toolbar using the Alt key or a mouse
340 – Exploring treemap charts to display hierarchical data
341 – Use the Quick Analysis tool for easy access to power tools
342 – Create a number series with the Ctrl key and left/right mouse button
343 – Combine IF, MAX, VALUE, and COUNTIF functions to analyze sales
344 – Unhide multiple worksheets at once and use the very hidden option
345 – Use the Fill Justify command to quickly rewrap text into different cells
346 – Create a 15th day or end-of-month series and adjust to weekdays only
347 – Use the Go To Special option to select and populate blank cells
348 – Accentuate values with conditional formatting and sparklines
349 – Transpose data with formula substitution and the TRANSPOSE function
350 – Use emojis and other symbols in formulas and charts
351 – Use the Advanced Filter for specialized filtering needs
352 – Combo charts: Combine different chart types to present data more clearly
353 – Combining the SEQUENCE, LEN, and MID functions to extract data into multiple cells
354 – Exploring Edit Default Layout options when using PivotTables
355 – Navigation tips: Shortcuts to jump within and between worksheets and workbooks
Attention! Distribution is carried out by adding new video lessons
Distribution is carried out by adding new video lessons, with each addition a new torrent is created. To start resuming a new lesson, users need to do the following:
• stop downloading
• delete the old torrent from your client (no need to delete old episodes)
• download a new torrent and run it in your client instead of the old one, while specifying the client the path to the old folder, where new video lessons should be downloaded
At the same time, your client must hash (verify) the old folder (if he does not produce it himself, help him do this), and will download only those episodes that you do not have yet. Old lessons are not deleted, but continue to be distributed.
If you have already deleted old episodes, then you can prevent the re-download of old video lessons by unchecking the appropriate boxes when starting a new torrent
For download this video training course (Excel 2021 Tips Weekly videos), please click to download sysmbol and complete your checkout to support a little bit to help my website is maintained. The download link will be appeared automatically after you complete your payment.

After you receive *.zip file, open it and open *.txt instruction’s file to see video for download instruction if you don’t know how to download.
All make sure you’ll get best services and we’ll help you any time when you get any problems. Don’t mind to contact admin: clickdown.org@gmail.com.
p/s: You also can request somethings which don’t have inside this website, we’ll try our best to them it for you.
Thank you.